Impact Profile: Why the Pros Use It
Introduction
The Impact Profile analyses the pedigree of a named horse or a hypothetical mating and shows how its key ancestor crosses have performed historically against expectation. Whether you are a breeder, a buyer, a trainer or a racing enthusiast, it gives you evidence for the part of a decision that pedigree can inform.
Accessing the Impact Profile
Click Impact Profile in the top menu and choose a tab:
- Named Horse: search for any horse in the database. See Running an Impact Profile on a Named Horse.
- Hypothetical Mating: enter a sire and dam to analyse a foal that does not exist yet. See Running an Impact Profile on a Hypothetical Mating.
- Compare Pedigrees: view two profiles side by side. See Comparing Two Pedigrees Side by Side.
- Roster Mating: run one mare against every stallion standing at a farm. See Roster Mating Explained.
Each search uses one Impact Profile search from your allowance, shown at the top right. Impact Analysis TIGHT is a Pro feature. See Buying and Managing Impact Profile Searches.
The five panels
The pedigree sits on the left and the analysis on the right, in five panels you can open and close.
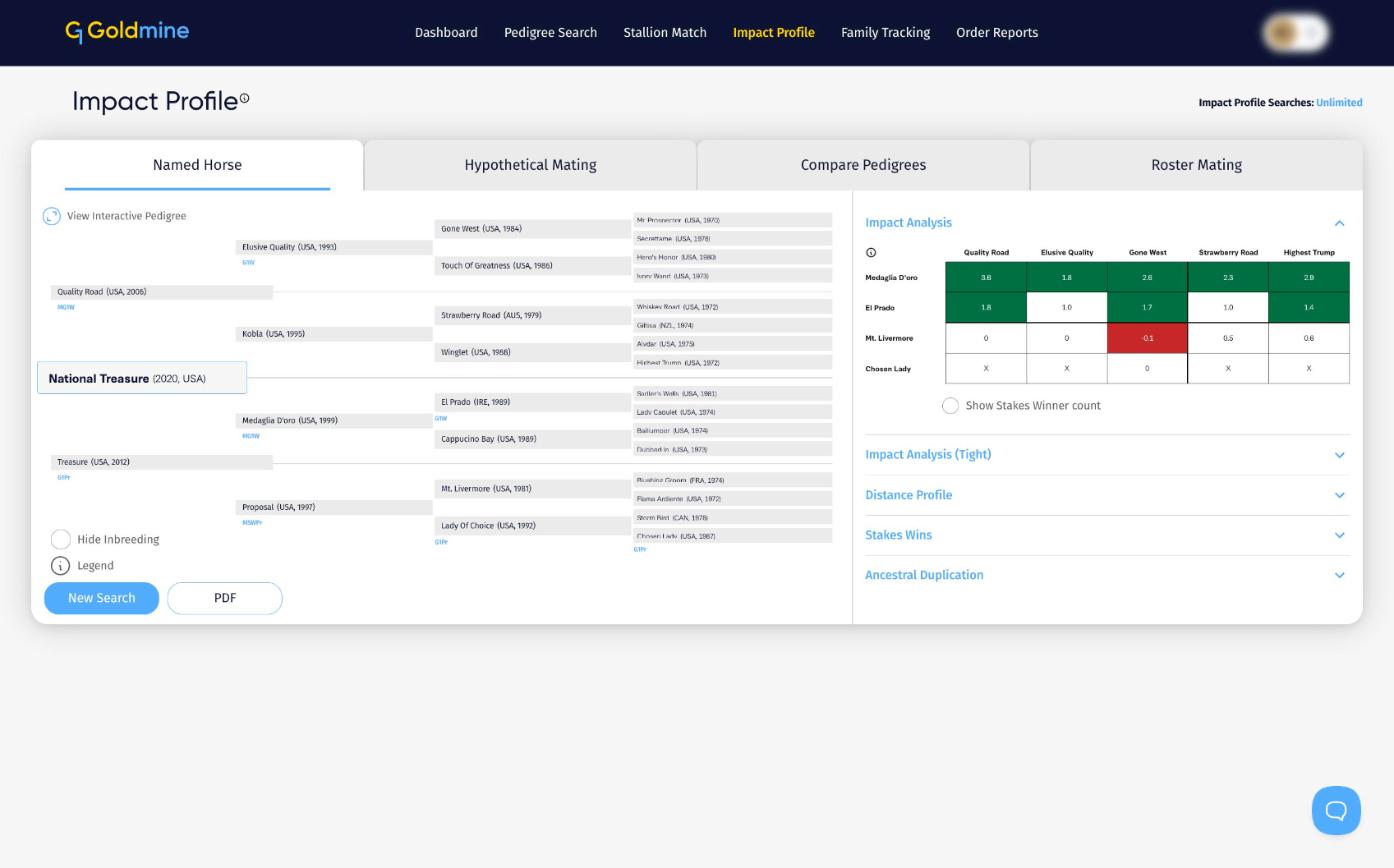
1. Impact Analysis
Impact Analysis uses an expectation algorithm. Rather than counting how many good horses a cross has produced, it compares what the cross actually produced against what its number of opportunities would predict. A cross given many chances is expected to produce more, and is judged accordingly.
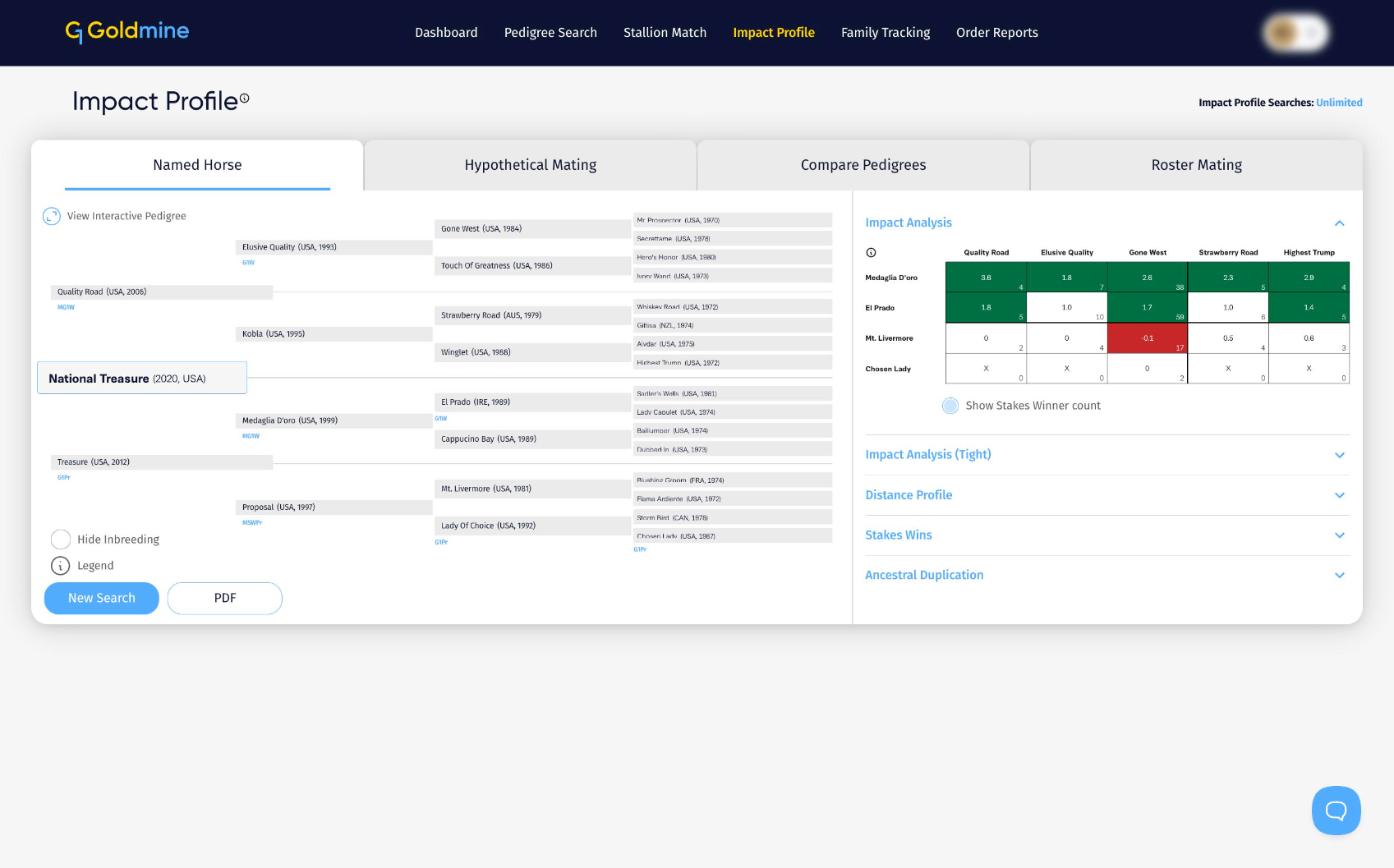
A total of 20 crosses across four generations are assessed, using both male and female ancestors. Including the female ancestors matters: a pedigree's influence does not arrive only through sires, and analysis restricted to the male side leaves a substantial part of the pedigree unexamined. Tick Show Stakes Winner count to see the number of stakes winners behind each cell.
2. Impact Analysis TIGHT
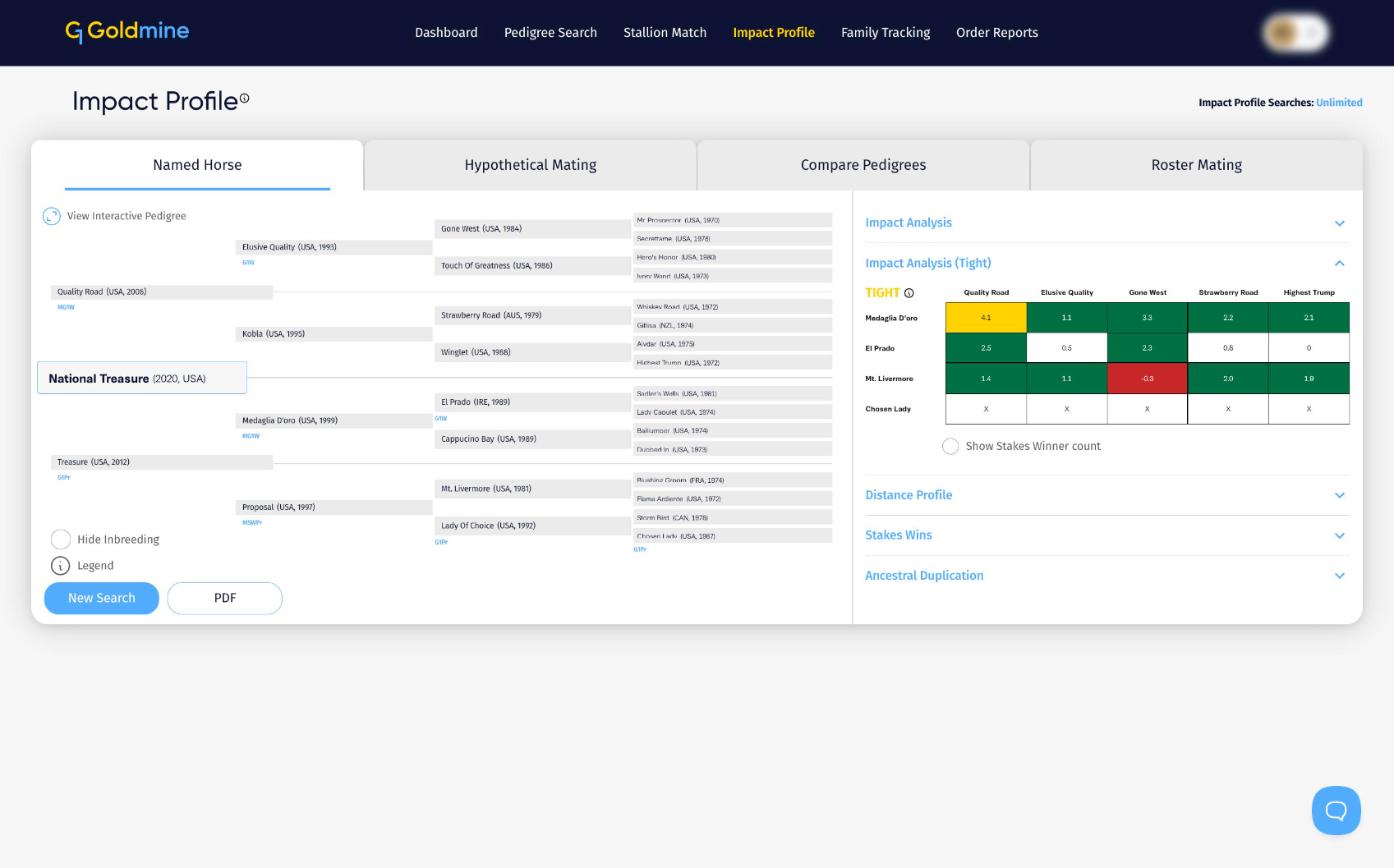
TIGHT is a stricter version of the standard analysis, available on G1 Goldmine Pro.
Standard Impact Analysis matches ancestors within pedigree halves. TIGHT narrows this to quarters, taking account of each ancestor's exact position in the pedigree rather than only which side it sits on.
The trade-off is sample size. Because TIGHT requires a closer structural match, fewer historical horses qualify for comparison, and a cross may return an X where there is too little data to compute a reliable expectation. An X is not a negative result. It means the question cannot be answered confidently on the data available.
Read the two together. Standard Impact Analysis gives the broad picture across more data. TIGHT tests whether the pattern holds up under a stricter definition. See Impact Analysis TIGHT Explained.
3. Distance Profile
A bubble chart of the distances at which stakes winners connected to the sire, grand sire, dam sire, dam grand sire and 4th dam actually won. Use Select Distance to see how each of them has performed at one trip. See Reading the Distance Profile.
4. Stakes Wins
The stakes races the horse has won, with the year, country, distance and surface. See The Stakes Wins Panel.
5. Ancestral Duplication
The ancestors that appear more than once in the pedigree. See Ancestral Duplication Explained.
How to read the scores
Each cross is scored and shaded so that the pattern can be read at a glance.
- Gold: well above expectation.
- Green: above expectation.
- White: in line with expectation.
- Red: below expectation.
- X: not enough data to compute an expectation. Neither good nor bad.
When comparing pedigrees, the useful question is how much green and gold a profile carries relative to red, and where the red sits. A red cross deep in the pedigree carries less weight than a red cross close up.
A profile weighted towards green and gold indicates a pedigree whose crosses have a record of outperforming expectation. A profile carrying a lot of red indicates the opposite, and is worth understanding before committing to a mating rather than treating as an automatic disqualification.
What the Impact Profile does and does not tell you
The Impact Profile identifies statistical patterns. It shows how the crosses within a pedigree have performed historically, relative to the opportunities they were given.
It does not predict which horses will win. A pedigree weighted towards green and gold does not guarantee a stakes winner, and a red cross does not condemn a horse. Racing outcomes depend on conformation, soundness, training, placement and luck, none of which appear in a pedigree.
Examples of elite racehorses
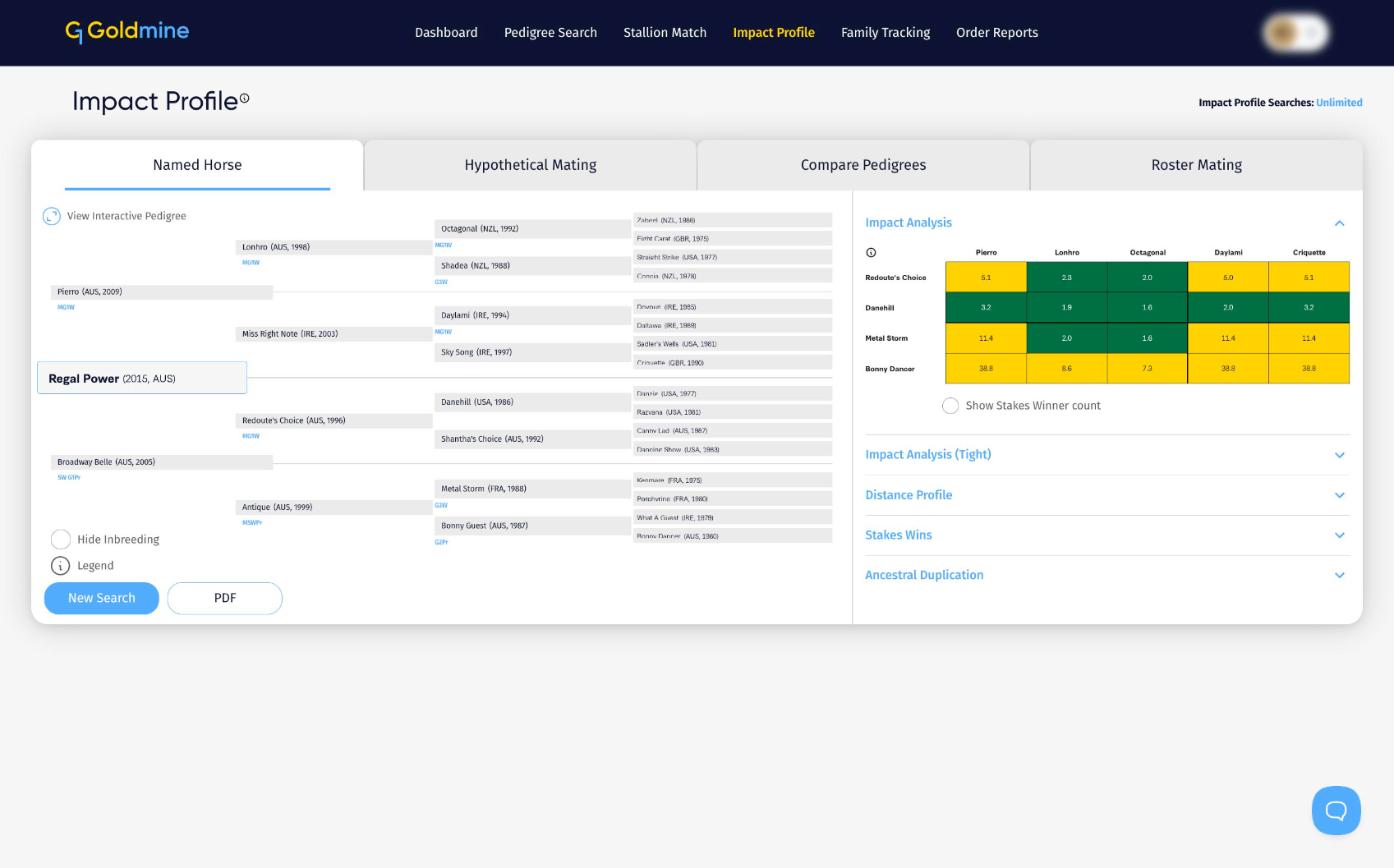
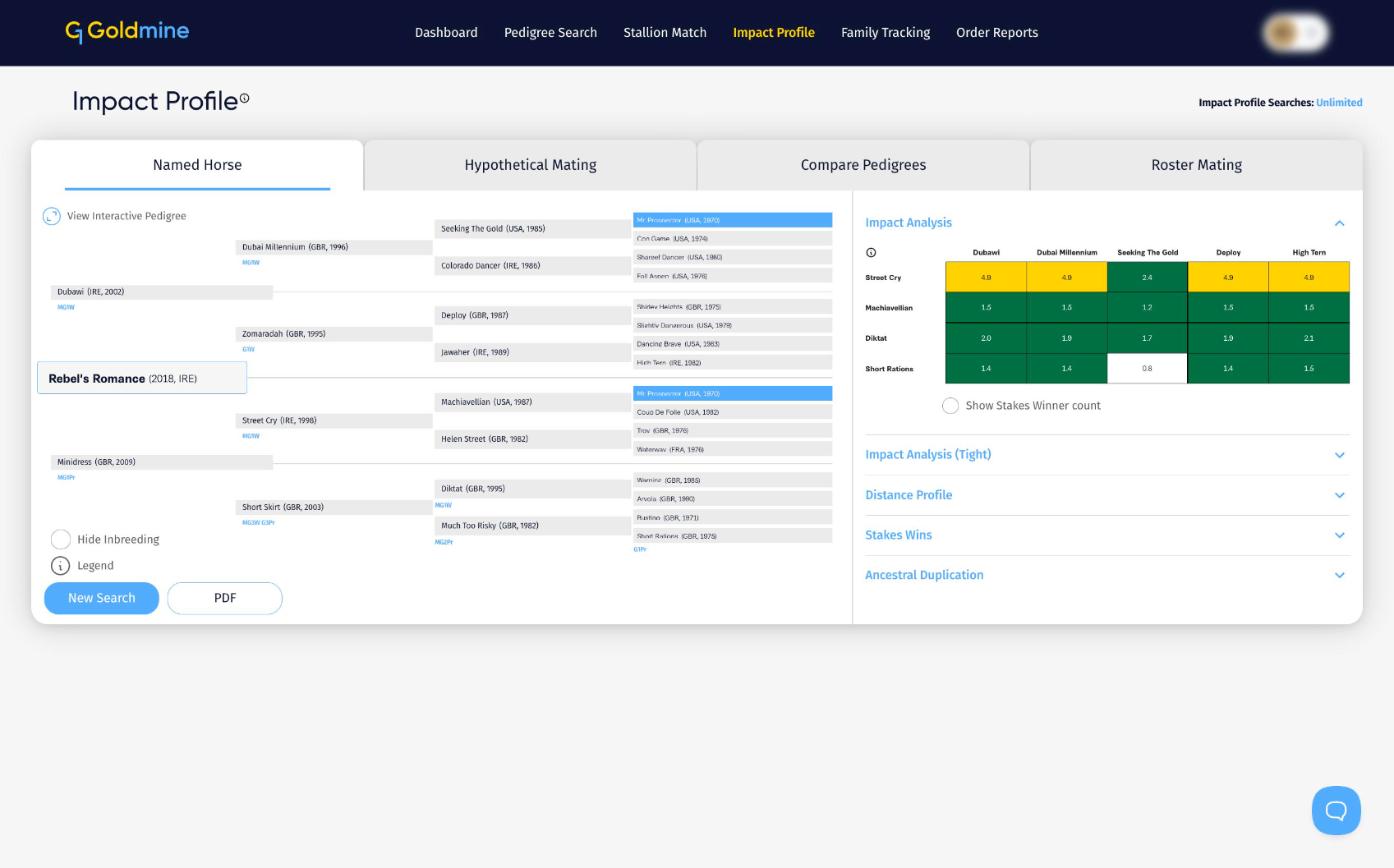
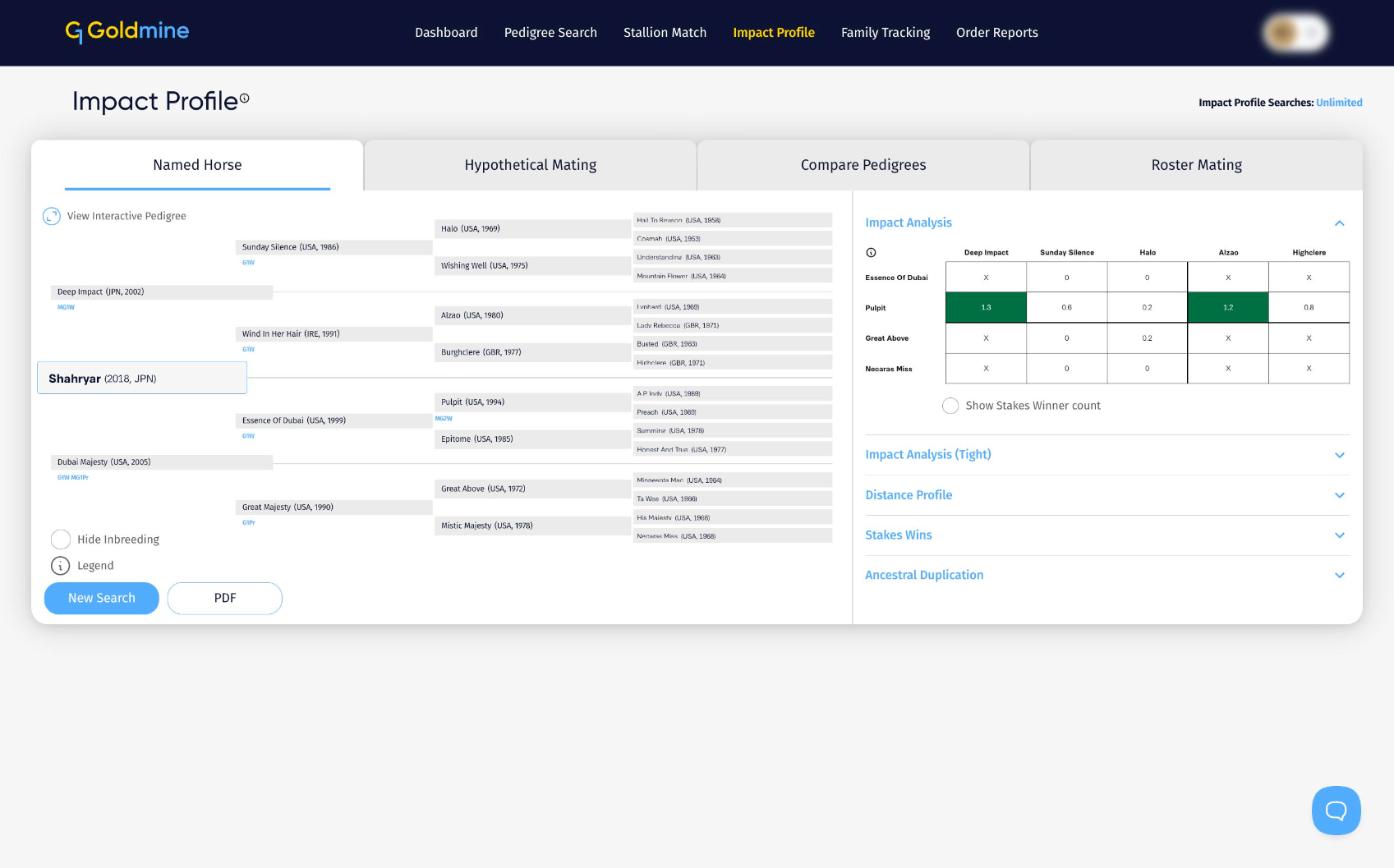
The Impact Analysis of four top-level performers. National Treasure, Regal Power and Rebel's Romance carry strong runs of green and gold. Shahryar shows that an X means too little data rather than a weak pedigree: several of his crosses have rarely been tried, so they cannot be scored.
National Treasure (USA)
Regal Power (AUS)
Rebel's Romance (IRE)
Shahryar (JPN)
Examples of underperforming racehorses
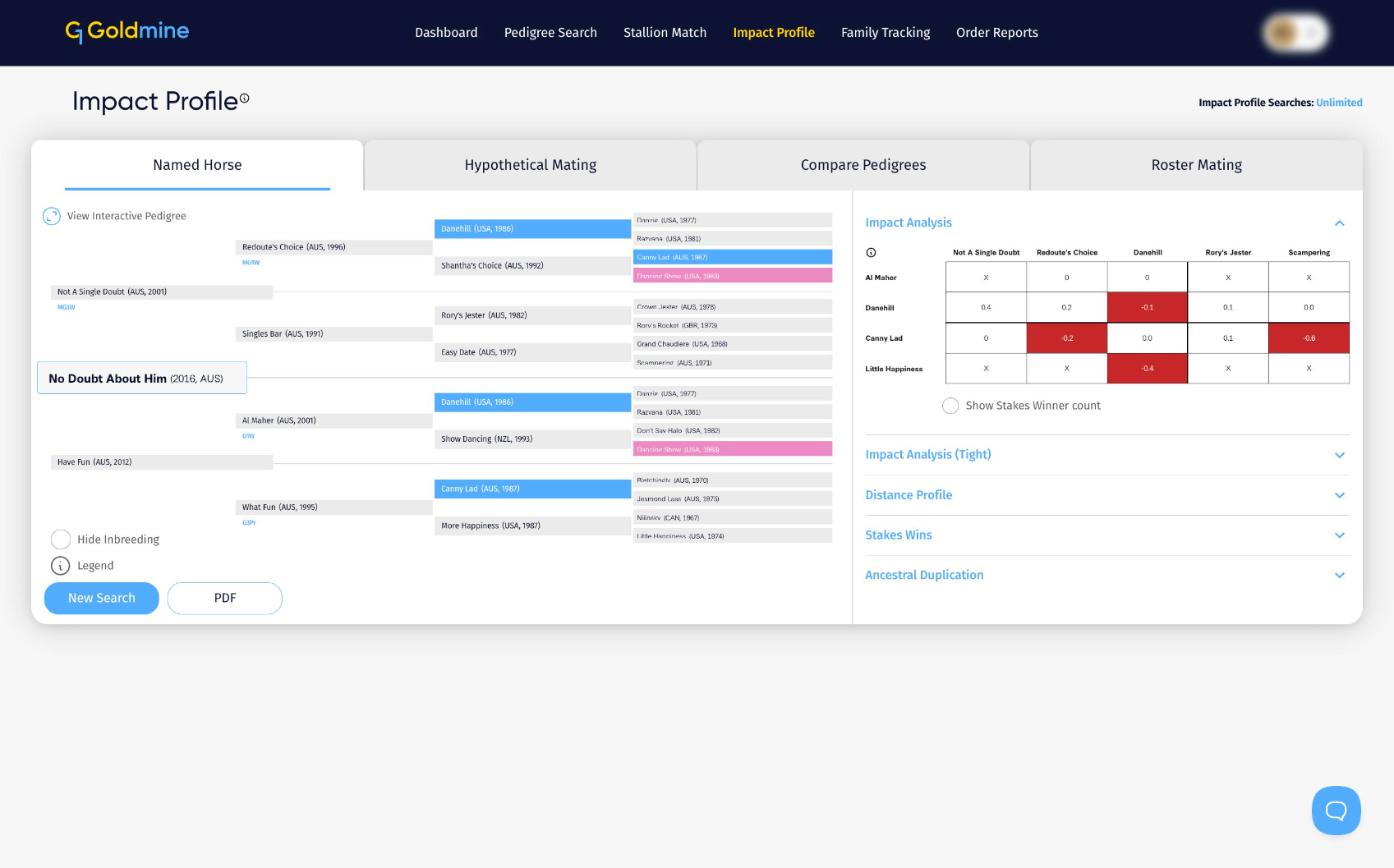
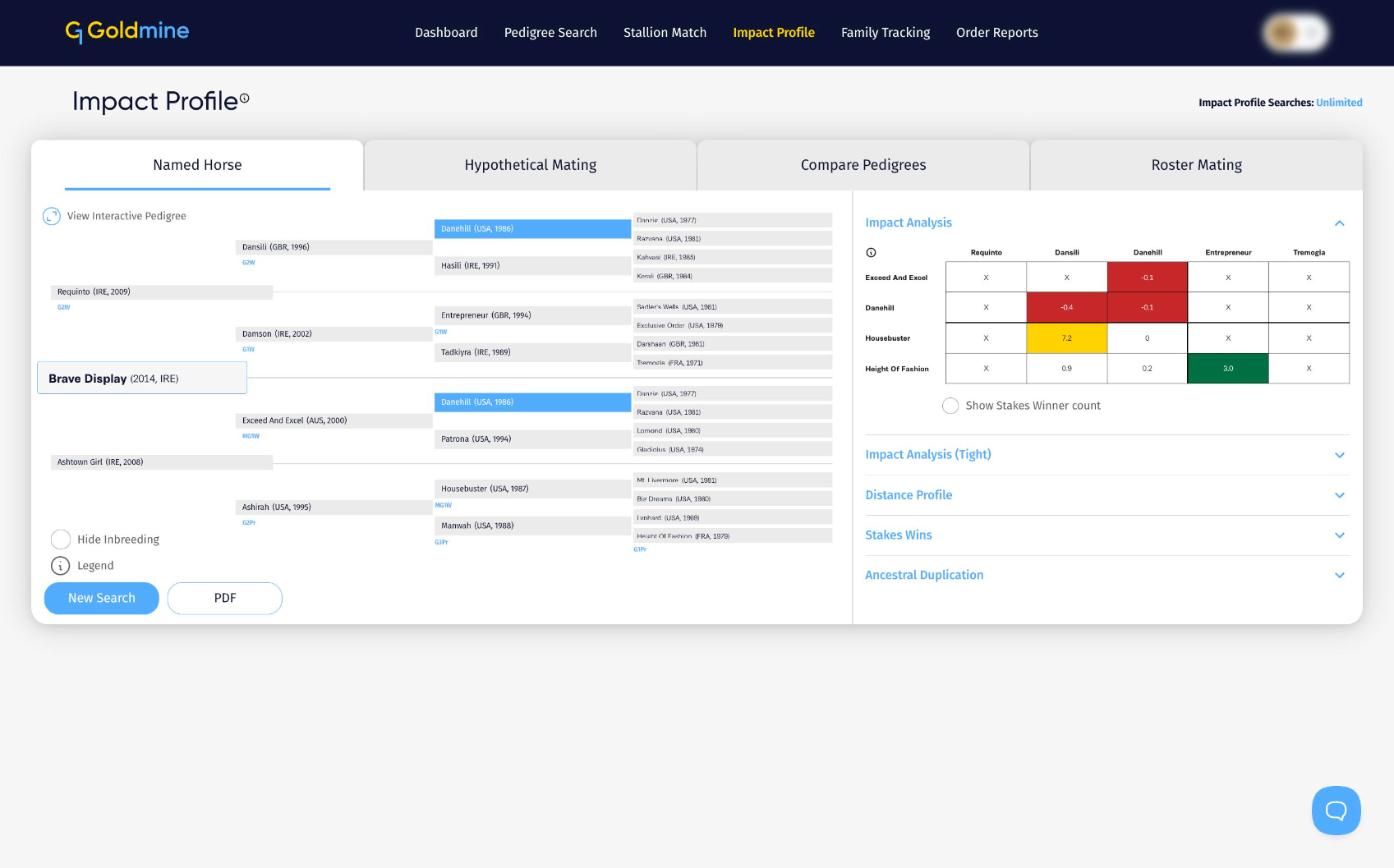
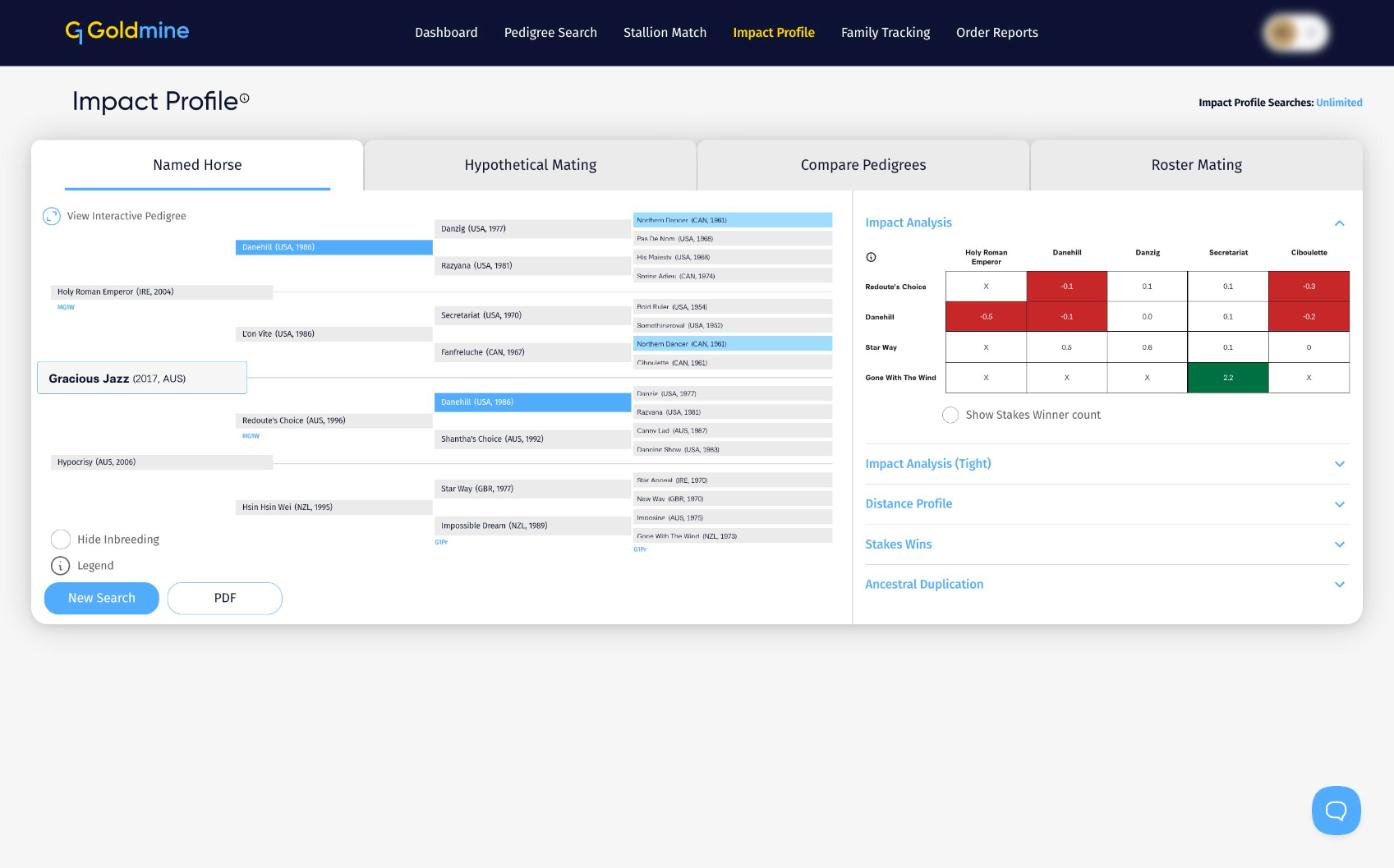
For contrast, three horses that raced with little success. Their pedigrees carry more red than green or gold.
Brave Display
Gracious Jazz
No Doubt About Him