
Impact Analysis TIGHT Explained
Impact Analysis TIGHT is a stricter version of the standard Impact Analysis. It asks the same question of the same 20 crosses, but it counts a match only when the ancestors sit in comparable positions rather than merely on the same side of the pedigree.
It is available on G1 Goldmine Pro without restrictions and limited with other plans.
Halves against quarters
Standard Impact Analysis matches on pedigree halves. An ancestor anywhere in the sire half of one pedigree can match an ancestor in the sire half of another, whatever position each occupies.
TIGHT narrows this to quarters. The ancestor's exact location is taken into account, so it is assessed as a maternal grandsire or a paternal great-grandsire specifically rather than as an influence somewhere on one side.
Fewer historical horses qualify as comparisons, and the ones that do resemble the pedigree more closely in structure.
The scale
Both grids use the same scale. The score compares what a cross actually produced against what its number of opportunities would predict, so 1.0 is the baseline and means the cross performed exactly as expected. A score of 2.0 means twice the expected number of stakes winners.
Reading the difference
The two grids use the same layout, so you can compare cell by cell. Where a score rises under TIGHT, the resemblance holds up under the stricter test and is structurally closer than the standard view suggested. Where it falls, the standard score was drawing on looser matches.
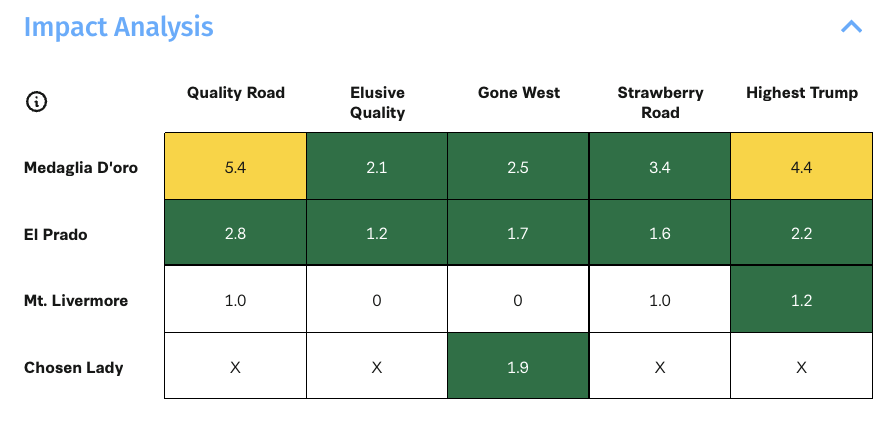
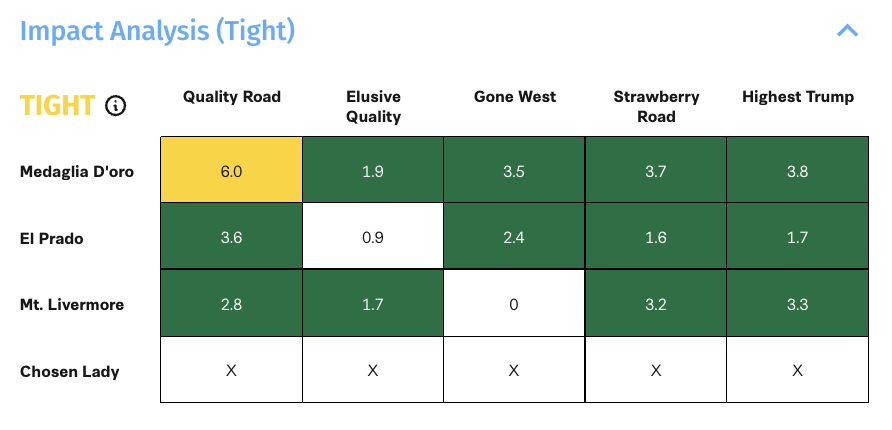
Taking National Treasure as an example, the Quality Road over Medaglia D'oro cross reads 5.4 on the standard view and 6.0 under TIGHT, so that combination strengthens when position is taken into account. In the same pedigree the Mt. Livermore row moves from 1.0 and 0 on the standard view to 2.8 and 1.7 under TIGHT.
Neither direction is automatically good or bad. What matters is that you now have two readings of the same cross rather than one.
The X, and why it appears more often
An X means there is too little data to compute a reliable expectation for that cross. It is not a negative result, and it is not a zero.
X appears far more often under TIGHT, because requiring a closer structural match reduces the number of comparable horses. In the National Treasure example the Chosen Lady row returns a single score of 1.9 on the standard view, and every cell in that row returns X under TIGHT. The cross has not been condemned. The stricter test simply cannot find enough comparable horses to judge it.
Treat a row of X marks as an absence of evidence rather than evidence of absence.
When to use it
TIGHT is most useful when you already have several candidates that look similar.
Standard Impact Analysis is the broader view, drawing on more data and giving a general read on whether a combination has worked. When three or four proposed matings all show respectable scores, TIGHT is the filter that separates them, because it shows which resemblances survive a stricter definition of a match.
Read the two together rather than treating TIGHT as a replacement. A cross that scores well on both is better supported than one that scores well on either alone.
Stakes winner counts
Both grids carry a Show Stakes Winner count option. Turning it on replaces the scores with the number of stakes winners behind each cross, which is the context you need before trusting any score. A strong figure resting on very few horses is weaker evidence than a moderate one resting on many.