
Reading the Distance Profile
The Distance Profile shows the distances at which stakes winners connected to a pedigree actually won. It answers the question every breeder and buyer asks about a young horse: how far is it likely to want?
It works from results rather than theory. Where dosage infers aptitude from ancestral influence, this chart shows what comparable horses did.
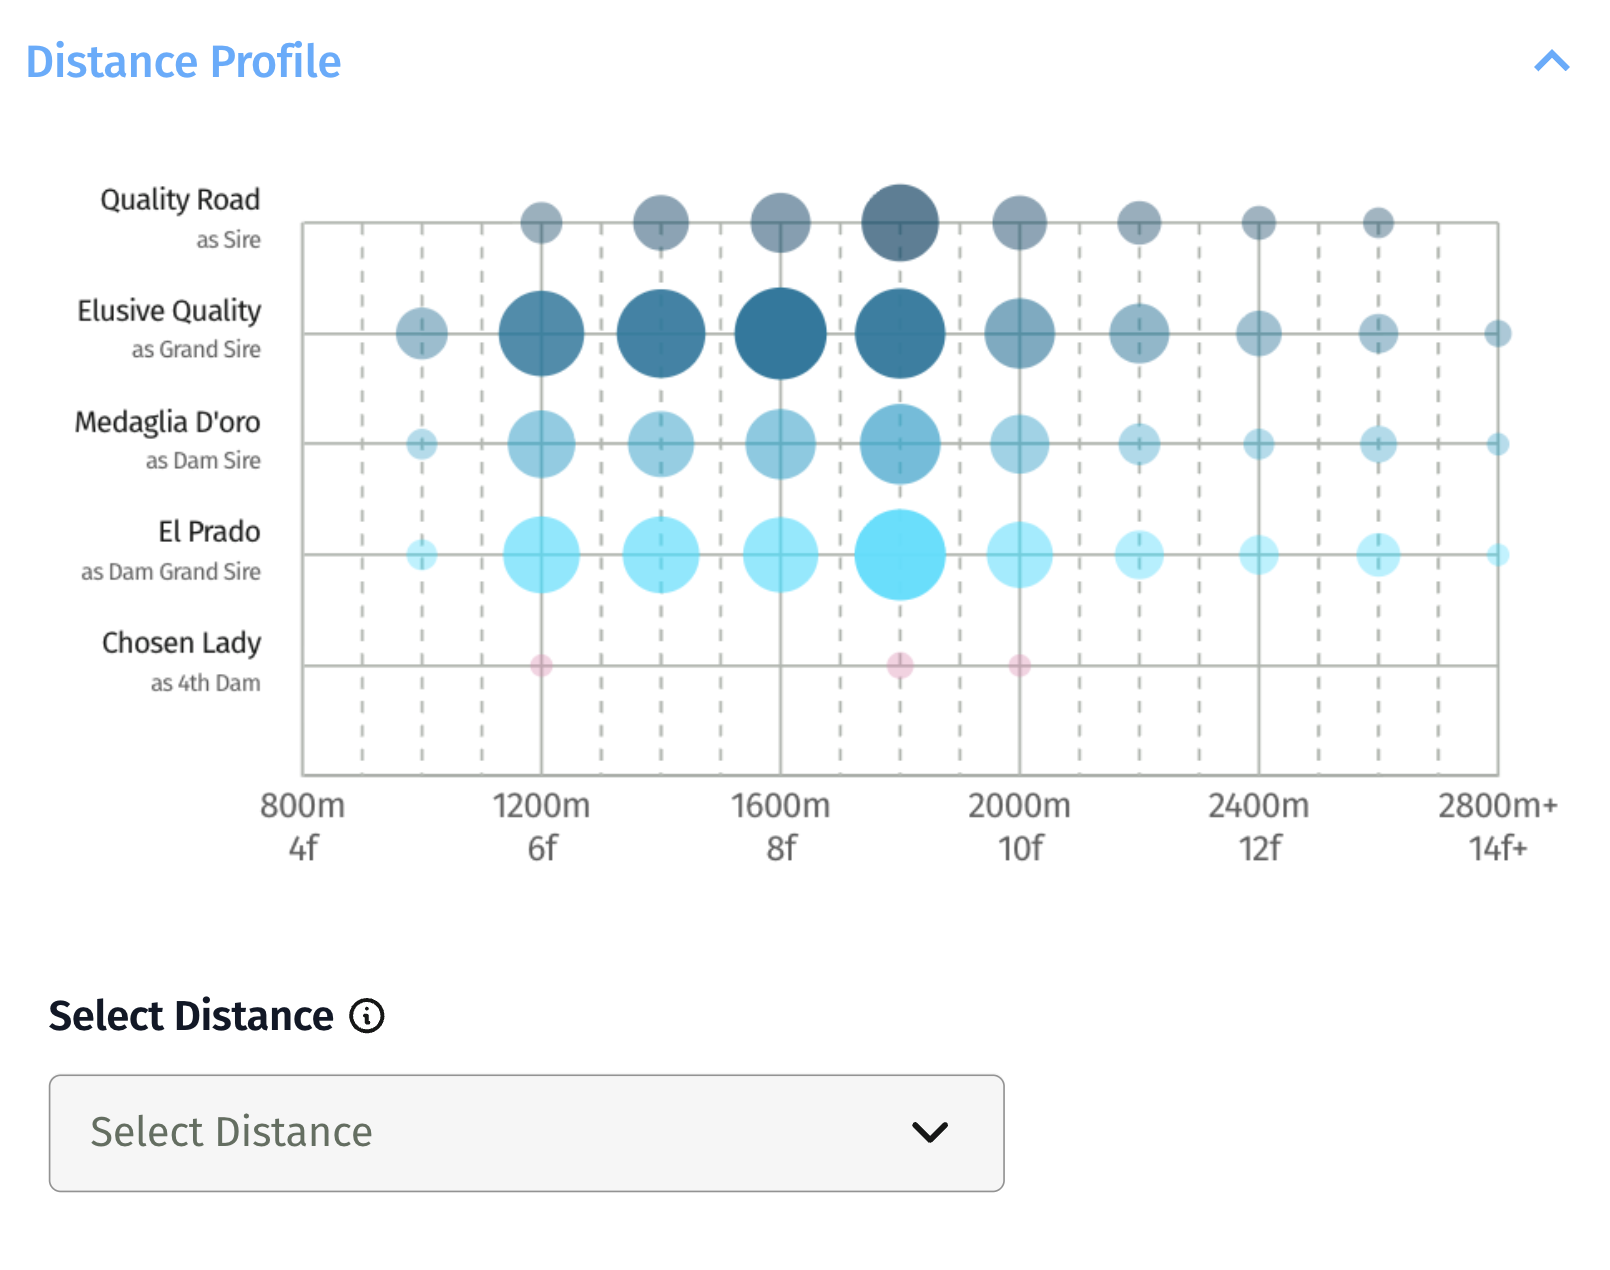
How the chart is built
The Distance Profile is a bubble chart with five rows, one for each of the key ancestors in the pedigree:
- Sire
- Grand Sire
- Dam Sire
- Dam Grand Sire
- 4th Dam
Distance runs along the bottom, from 800m and 4f at the left through to 2800m and 14f or more at the right, labelled in both metric and imperial.
Each bubble represents stakes winners at that combination of ancestor and distance. The larger the bubble, the more winners it contains.
Reading the shape
The pattern matters more than any single bubble.
Weighted to the left. Bubbles clustered at the shorter distances point to speed and often to precocity.
Weighted to the right. Bubbles clustered further out point to a horse that will want time and distance.
Spread across the range. The pedigree has produced winners at many distances. That can mean genuine versatility, or it can mean the ancestors are not strongly directional and the chart is not telling you much.
Rows disagreeing. A sire line weighted short against a dam line weighted long is common and worth noticing. It tells you the foal could go either way, and that the physical individual will decide more than the pedigree does.
Comparing the rows
Reading down the rows is often more useful than reading across one.
Each row is a different ancestor at a different distance from the horse, so agreement between them is meaningful. Where all five rows concentrate in the same part of the range, the pedigree is pointing consistently. Where the top rows and the bottom rows sit in different places, the influences are pulling against each other.
What it does not tell you
The chart describes tendency, not destiny. Individual horses depart from their pedigree regularly, and conformation, temperament, training and placement all shape what a horse can do.
It also reflects the racing programmes those winners ran in. A pedigree that produced winners at a mile in a jurisdiction with few longer races has not been tested at further, and absence of bubbles at a distance is not proof a family cannot stay.
Where it sits
The Distance Profile is one of five panels in the Impact Profile, alongside Impact Analysis, Impact Analysis TIGHT, Stakes Wins and Ancestral Duplication.
It runs on hypothetical matings as readily as on named horses, so you can see the likely distance range of a cross before it exists. See Running an Impact Profile on a hypothetical mating.