
Our Broodmare Analysis Report
The Broodmare Analysis Report pairs your mare with up to 150 stallions and ranks every mating, strongest cross first. It opens online in My Reports, so each mating has room for its full analysis instead of a one-page summary.
This guide walks through the report using a real example, Lake Victoria (IRE, 2022), analysed against stallions in Kentucky and California.
Opening your report
Go to My Reports from the menu under your initials, open the Broodmare Reports tab and choose your mare from Select Order. Not ordered one yet? See How to Order a Broodmare Report on G1 Goldmine.
The ranked list
The first page lists every stallion analysed, with the location and fee range you chose shown above the table.
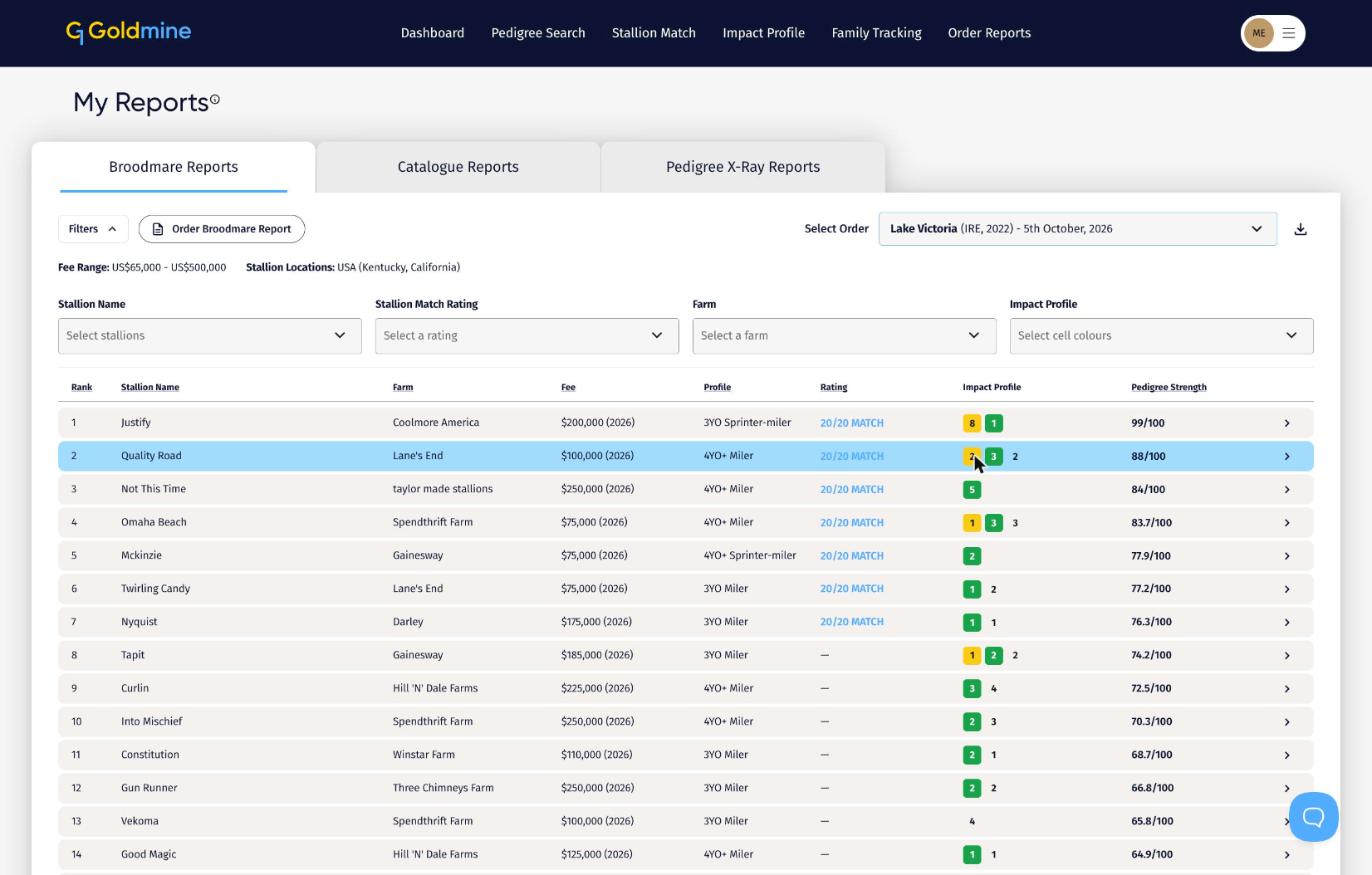
- Rank: the stallion's position, based on Pedigree Strength.
- Stallion Name, Farm and Fee: the fee shows the season it applies to.
- Profile: the age and distance where similar pedigrees have done best, such as 3YO Sprinter-miler or 4YO+ Miler.
- Rating: the Stallion Match result, shown as 20/20 MATCH or PERFECT MATCH. A dash means neither pattern was found. See Understanding the Ratings.
- Impact Profile: a count of the 20 crosses by colour. Gold boxes are crosses well above expectation, green boxes are above expectation, red boxes are below, and a plain number counts crosses at expectation. Hover over the counts to see the full grid.
- Pedigree Strength: a score out of 100 measuring how well the pedigree's ancestor crosses have historically produced stakes winners. It appears as Pedigree Score on each mating page.
Filters
Click Filters to narrow the list by Stallion Name, Stallion Match Rating, Farm or Impact Profile. The Impact Profile filter shows only matings with no red cells, at least one red cell, two or more gold cells or two or more green cells.
Downloading the list
The download icon beside Select Order saves a spreadsheet summary of the ranked list.
Each mating in detail
Click any stallion to open the full analysis of that mating. Use the arrows at the top right to move to the previous or next stallion, or Back to index to return to the list. The download icon saves a PDF of the whole mating page.
Pedigree Score and Stallion Match
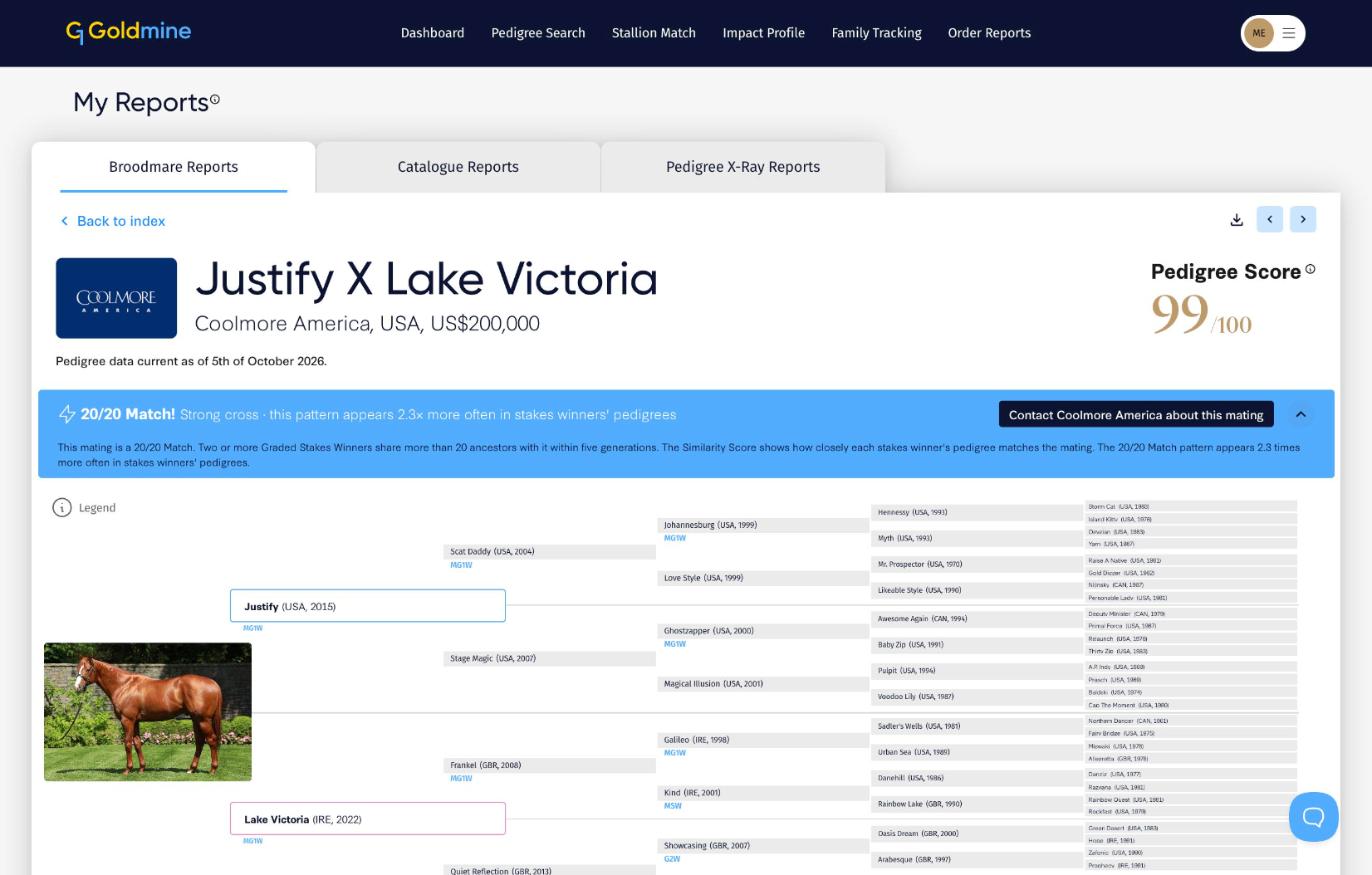
The header shows the stallion, his farm, location and fee, with the Pedigree Score out of 100. Under it, the date the pedigree data was last refreshed when you ordered.
If the mating is a 20/20 Match or Perfect Match, a banner says so. Click the arrow on the banner for the full explanation.
- 20/20 Match: two or more Graded Stakes winners share more than 20 ancestors with the mating within five generations. This pattern appears 2.3 times more often in stakes winners' pedigrees.
- Perfect Match: a 20/20 Match that also shares a common ancestor in every quarter of the pedigree. 24% of stakes winners carry a Perfect Match, against 3% of underperforming horses.
The banner also has a button to contact the stud farm about this mating. If the farm has a Match Offer on that stallion, it shows here too. See Contacting a Stud Farm.
Pedigree chart
A five-generation pedigree of the hypothetical foal, with the stallion's photo. Race and produce achievements appear under each ancestor, such as MG1W for a multiple Group 1 winner or G1Pr for a Group 1 producer. Click Legend for the full list of abbreviations.
Pedigree badges
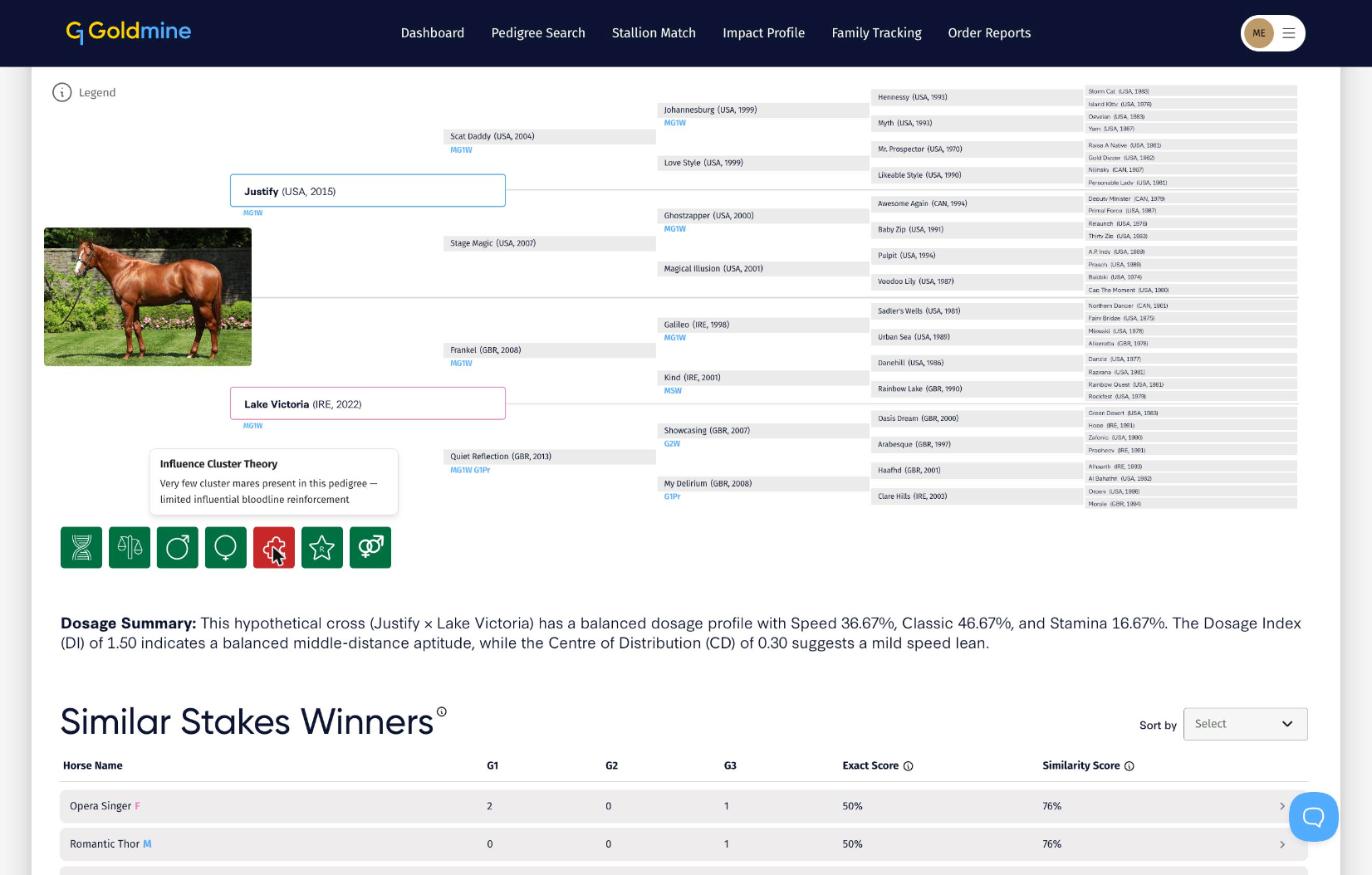
Seven badges under the chart summarise the pedigree's structure. Hover over each one to read what it found for this mating. Green means a favourable result and red flags something to look at more closely.
- Linebreeding / Duplication Density: how much ancestor duplication the pedigree carries.
- Balance / Symmetry: whether duplication is spread across both sides of the pedigree.
- Male Transmission Bias and Female Transmission Bias: how much influence flows through male and female lines.
- Influence Cluster Theory: whether influential mares cluster in the pedigree.
- Rasmussen Theory: duplication of top mares through different offspring. See Rasmussen Theory Explained.
- Sex Balance Theory: whether an influential ancestor is duplicated through both a son and a daughter.
For more on duplication, see Ancestral Duplication Explained and the Seven Breeding Theories.
Dosage Summary
A short summary of the mating's dosage profile, with the Speed, Classic and Stamina split, the Dosage Index (DI) and the Centre of Distribution (CD). See Dosage Explained.
Similar Stakes Winners
Stakes winners whose pedigrees resemble this mating, with their Group 1, Group 2 and Group 3 wins, Exact Score and Similarity Score. Use Sort by to order the table by any column, and click a horse for its details. See Understanding the Exact Score and Similar Score.
Impact Profile and TIGHT
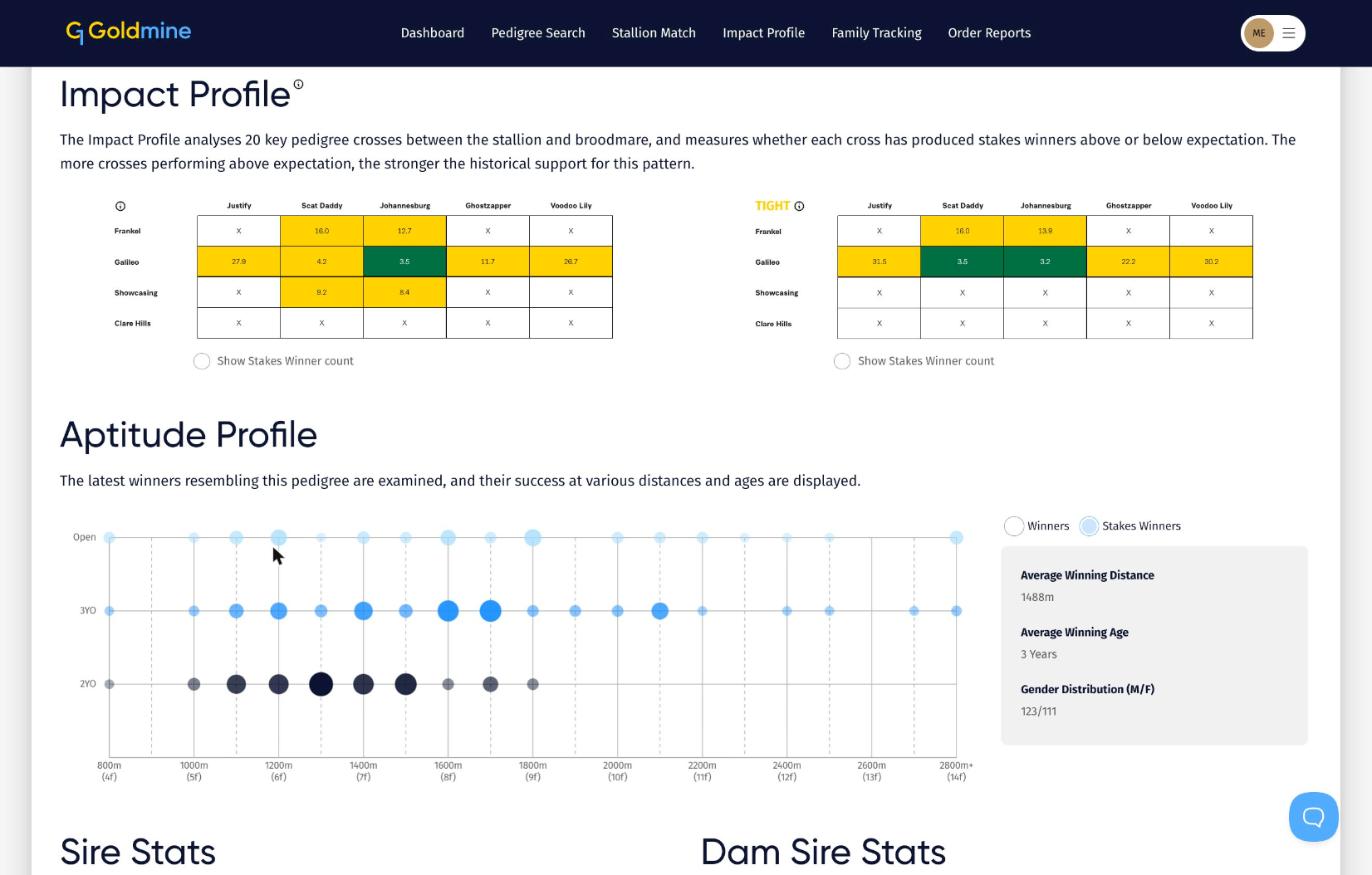
Two 5 by 4 grids showing the 20 key crosses between the stallion's and mare's ancestors, each coloured by how that cross has performed against expectation: gold well above, green above, white at expectation and red below. An X means there is not enough data for that cross.
The second grid uses TIGHT, which only counts a stakes winner when the two ancestors sit in the same quarter positions, so green and gold are a stronger signal. Tick Show Stakes Winner count under either grid to see the number of stakes winners behind each cell. See Impact Profile and Impact Analysis TIGHT Explained.
Aptitude Profile
A chart of the latest winners resembling this pedigree, plotted by distance and age, with the average winning distance, average winning age and the male to female split. Switch between Winners and Stakes Winners above the chart. See Aptitude Profile Explained.
Sire, Dam Sire, Grand Sire and Nicking Stats
Runners, winners, stakes winners and strike rates for the stallion, the mare's sire and the stallion's sire, plus the nick between the stallion and the mare's sire. Click View in Pedigree Search to explore any of them further.
Sibling Snapshot
Sales results and race records for horses out of the mare's first three dams, so you can see whether the family is producing runners and selling well. See Sibling Sales Snapshot Explained.
Market Context and Sire's Progeny
Market Context shows the stallion's yearling sales, including median, average, top and lowest prices, yearlings sold and 2YO winners. Sire's Progeny lists his recent stakes winners, with a link to the complete list.
Frequently asked questions
What is the Pedigree Score and how is it calculated?
The Pedigree Score, sums up the whole mating in one figure. It brings together three things:
- The pedigree's record. How often the stallion, his sire, the mare's sire and the nick between the stallion and the mare's sire have produced stakes winners from their runners, the black type further back in the pedigree, and the mare's own family, including what she and her first two dams have produced.
- The Impact Profile. Gold and green cells add to the score and red cells take away from it.
- The Stallion Match result. A 20/20 Match adds to the score and a Perfect Match adds more.
The exact weightings are part of G1 Goldmine's own model and are not published. The score is best used to compare the stallions in your own report, rather than as a pass mark.
How can a mating have red cells and still have a good Pedigree Score?
The score weighs the whole pedigree, not one cross. A single red cell alongside gold or green cells does not count against the score, while two or more red cells take points off. A strong record through the sire and dam sire lines, gold and green crosses elsewhere and a 20/20 or Perfect Match can still lift a mating well up the list.
A red cell means one cross has produced fewer stakes winners than expected. Tick Show Stakes Winner count to see how many stakes winners sit behind it, and check the TIGHT grid. Treat a red cell as something to look into rather than a reason on its own to rule a stallion out.
Getting the most from your report
- Start with the ranked list and filter for Stallion Match results and Impact Profiles with no red cells.
- Open your shortlist and compare the TIGHT grid, the Similar Stakes Winners and the Aptitude Profile against what you want from the foal.
- Check the Sibling Snapshot and Market Context if you plan to sell.
- Contact the farm straight from any mating page.
The report supports your decision with historical pedigree and racing patterns. Breeding outcomes depend on many factors and no result is guaranteed.