
Evaluate Ancestor Success with Pedigree Search
Every Pedigree Search ends on a results page that shows the stakes winners carrying your pattern and how that pattern has performed. This guide walks through the page using Snitzel in H1 as the example.
Stakes Winners
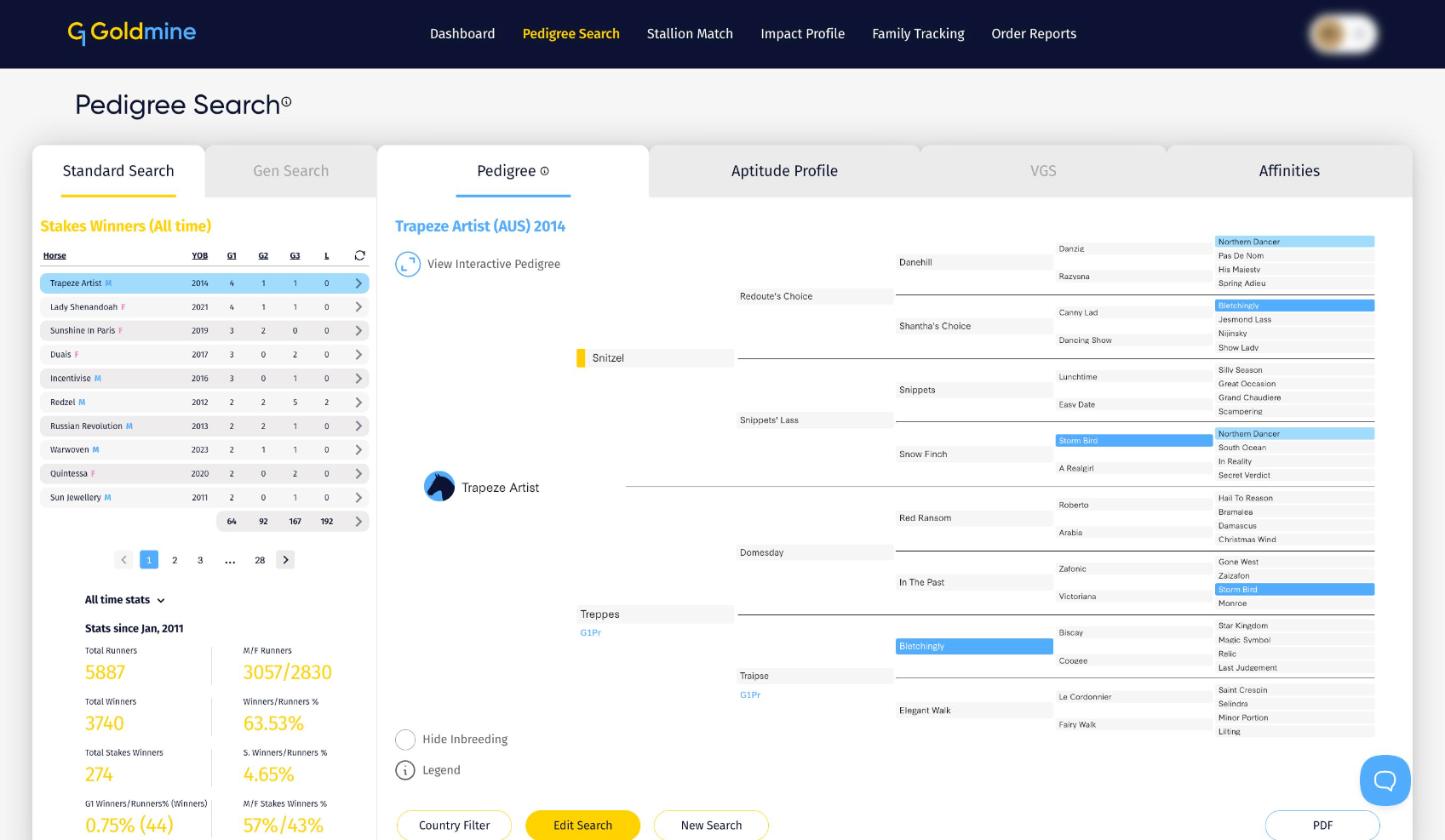
The list on the left shows every stakes winner carrying your pattern, ordered by their best wins. For each horse you'll see the year of birth (YOB), the number of Group or Grade 1, 2 and 3 wins and Listed (L) wins, and M or F for male or female.
- Click a horse to show its pedigree on the right.
- Click the arrow at the end of a row to see that horse's stakes wins, with the race, year, country, distance and surface.
- The bottom row totals the wins at each level. Click its arrow to open Stakes Wins by Year, which shows the runners, stakes wins and strike rate for each year since 2011.
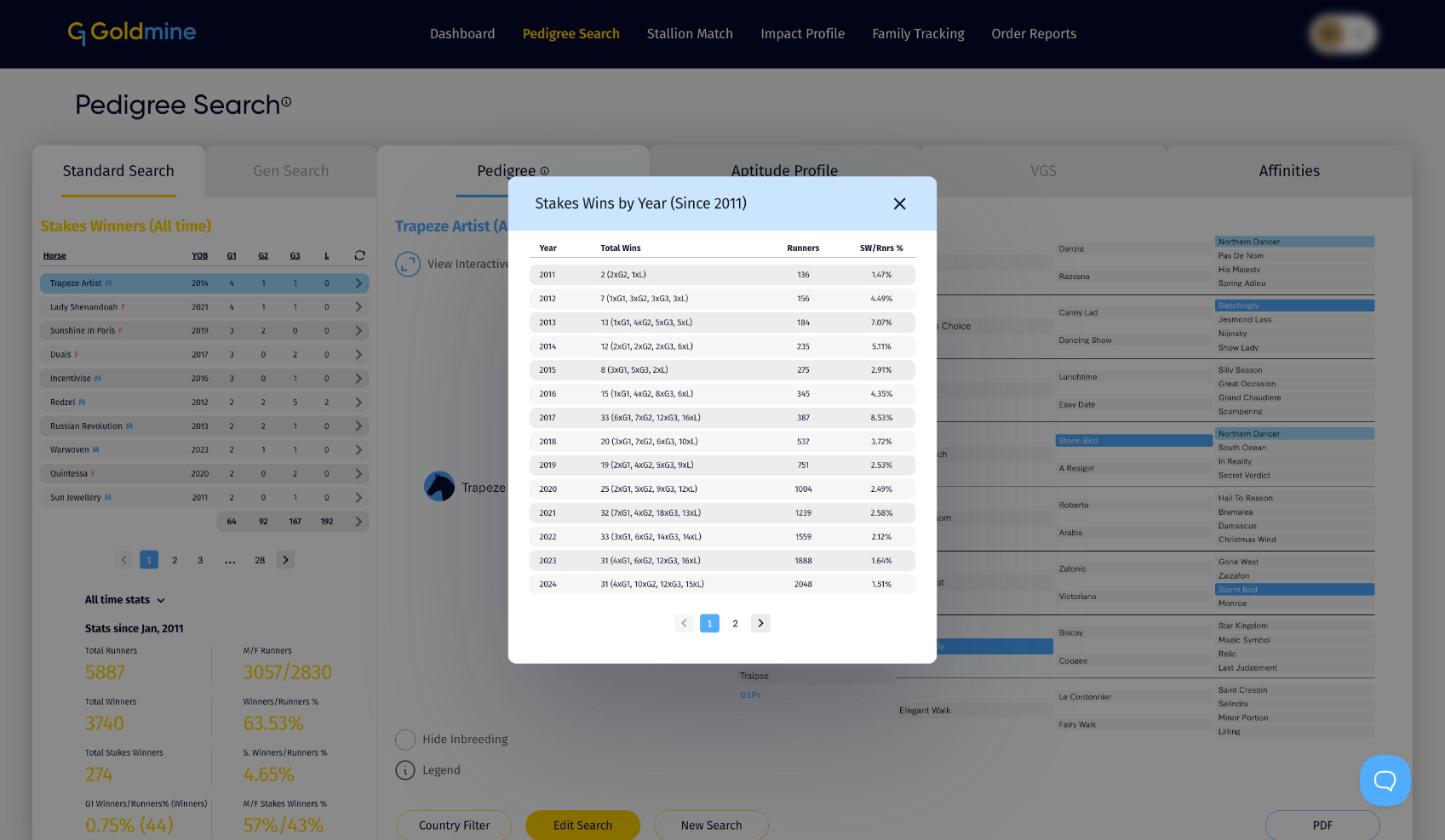
For more on the stakes wins view, see The Stakes Wins Panel.
The stats
Under the list, Stats since Jan, 2011 shows how the pattern has performed:
- Total Runners and M/F Runners
- Total Winners and Winners/Runners %
- Total Stakes Winners and S. Winners/Runners %, the stakes winner strike rate
- G1 Winners/Runners %, with the number of Group 1 winners in brackets
- M/F Stakes Winners %
Open All time stats to see total runners across all years, not just since 2011.
With Snitzel in H1, the search returns 5,887 runners and 274 stakes winners, a strike rate of 4.65%. Add Encosta De Lago in H2 and it narrows to 453 runners and 19 stakes winners, a strike rate of 4.19%. Always check the runner count before relying on a percentage, as small samples can swing widely.
The tabs
Pedigree
The pedigree of the horse selected in the list. The ancestors you searched for are marked with a yellow bar, and duplicated ancestors are highlighted. Click View Interactive Pedigree to explore it full screen. See Using the Interactive Pedigree Chart and Pedigree Chart Abbreviations.
Aptitude Profile
A chart of where the stakes winners won by distance and age, with a table by country showing wins by level, sex, age, distance range and surface. See Aptitude Profile Explained.
VGS
The Ventura GeoScore compares how many Group 1 winners a cross has produced with how many would be expected, country by country. A score of 1.00 means exactly as many as expected, above 1.00 means better than expected and below 1.00 means worse. VGS is available when you search both sides of the pedigree. See Ventura GeoScore (VGS) Explained.
Affinities
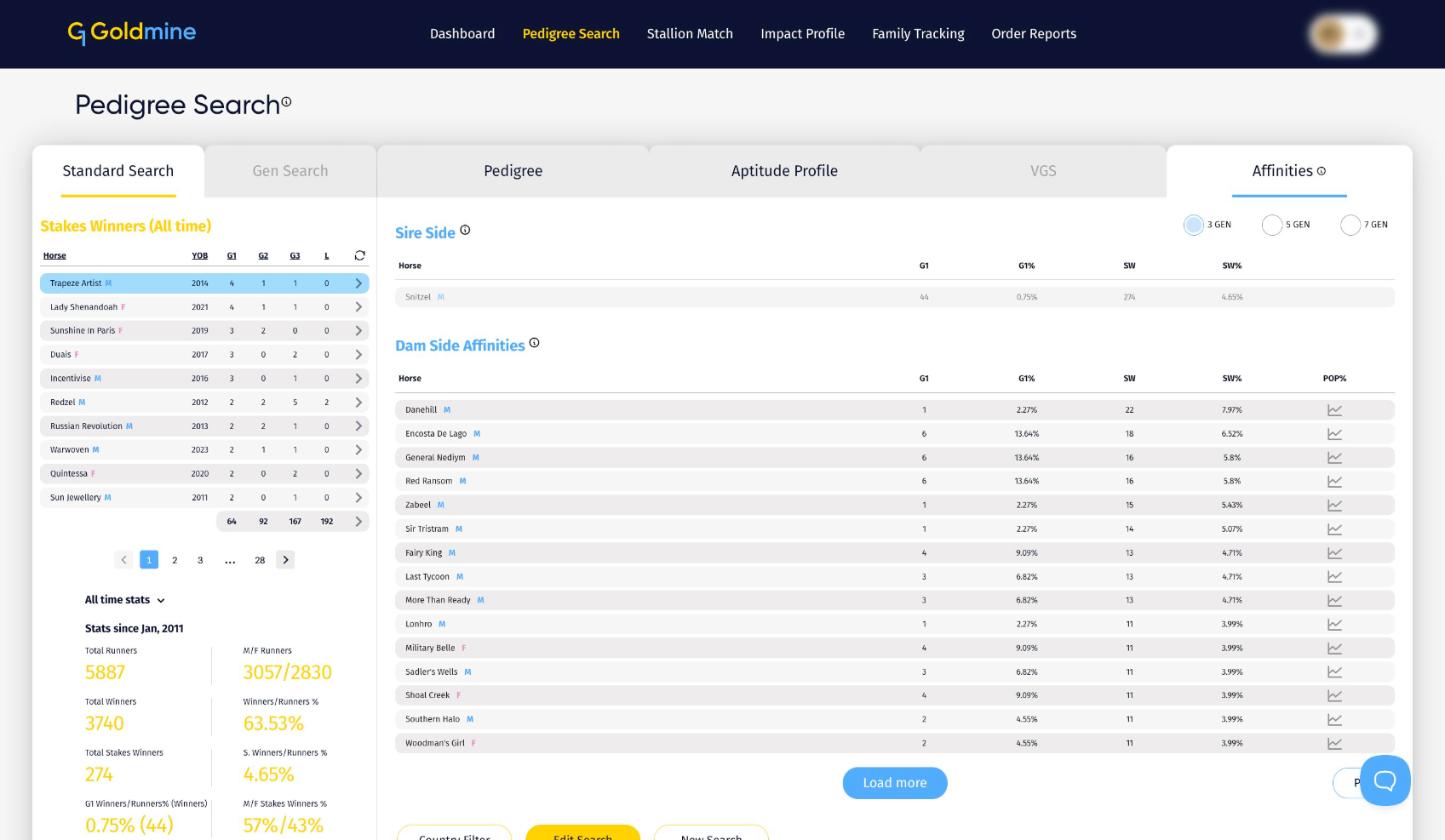
When you search one side of the pedigree only, Affinities lists the ancestors most often found on the other side of your stakes winners, with their Group 1 winners, stakes winners and strike rates. Choose 3, 5 or 7 generations at the top right, and click Load more to see further down the list. These are the partners worth testing in your next search.
Next steps from the results
- Edit Search: change your ancestors or positions and run the search again.
- New Search: start from a blank search.
- Country Filter: limit the results to runners that raced in the countries you choose. See Using the Country Filter.
- PDF: download the page.
To narrow a search to particular positions, see Using Strain, Sireline and Tail Female Line and Understanding H and Q Searches.